Introduction to Curves

Introduction to Curves
Introduction to Curved Lines
Overview
A curve is a line that joins two or more points. If only two points are involved, the line would join them but the line is not straight. If there are three points A, B, and C, the line would start on the first point A, cross the second point B, and stop at the last point C. If more than three points are involved, the line would start on the first, cross the second, cross the third and each line before stopping on the last. The points of a curve don't have to be aligned.
The whole idea of drawing a curve is to have a non-straight line that joins different non-aligned points. This can be illustrated with the following three curves labeled C1, C2, and C3:

The first curve, C1, includes only two points. The second, C2, includes three points. The third, C3, includes four points.
The section between two points is called a segment. This also means that a curve can be defined by the number of segments it has. If a curve is made of only two points, this means that it has only one segment from the first to the second, which is the last, point. If a curve includes three points, it has two segments. The first segment spans from the first point to the second point and the second segment spans from the second point to the third point. Based on this, the number of segments of a curve is equal to the number of its points - 1.
A Curve from Points
To support curves, the Graphics class is equipped with an overloaded method named DrawCurve. When drawing a curve, you must specify the number of points to be involved. This means that you can first declare an array of Point or PointF objects. Because it is left up to you to decide on this issue, the Graphics class provides the following syntaxes of the DrawCurve() method:
public void DrawCurve(Pen pen, Point[]   points);
public void DrawCurve(Pen pen, PointF[] points);
This version of the method takes an array of Point or PointF values as arguments. The number of members of the array depends on you. Here is an example that uses four points to draw a curve with three segments:
private void Exercise_Paint(object sender, PaintEventArgs e)
{
    Pen pnRed = new Pen(Color.FromArgb(155, 255, 15, 15), 1.50F);

    Pen penCurrent = new Pen(Color.Blue, 4.50F);
    Point[] pts = { new Point( 40,  42),
                    new Point(188, 246),
                    new Point(484, 192),
                    new Point(350,  48) };

    e.Graphics.DrawCurve(penCurrent, pts);

    e.Graphics.DrawEllipse(pnRed, pts[0].X - 10, pts[0].Y - 10, 20, 20);
    e.Graphics.DrawEllipse(pnRed, pts[1].X - 10, pts[1].Y - 10, 20, 20);
    e.Graphics.DrawEllipse(pnRed, pts[2].X - 10, pts[2].Y - 10, 20, 20);
    e.Graphics.DrawEllipse(pnRed, pts[3].X - 10, pts[3].Y - 10, 20, 20);
}
This would produce:

Introduction to the Tension of a Curve
As you can see from the above result, when the curve is drawn, a bent line crosses the intermediary points between the first and the last. To make the lines non-straight, the compiler uses a value called tension used to bend the line. If you want, you can specify the bending factor that should be applied. To support this, the Graphics class provides the following versions of the DrawCurve() method:
public void DrawCurve(Pen pen,
                      Point[]points,
                      float tension);
public void DrawCurve(Pen pen,
                      PointF[] points,
                      float tension);
The amount of bending to apply is passed as the tension argument. It can be passed as a decimal value >= 0.00. If this value is passed as 0.00, the lines would be drawn straight. Here is an example:
private void Exercise_Paint(object sender, PaintEventArgs e)
{
    Pen pnRed = new Pen(Color.FromArgb(155, 255, 15, 15), 1.50F);

    Pen penCurrent = new Pen(Color.Blue, 4.50F);

    Point pt1 = new Point( 40,  42);
    Point pt2 = new Point(188, 246);
    Point pt3 = new Point(484, 192);
    Point pt4 = new Point(350,  48);
    Point[] pts = { pt1, pt2, pt3, pt4 };

    e.Graphics.DrawCurve(pen: penCurrent, tension: 0.00F, points: pts);

    e.Graphics.DrawEllipse(pnRed, pt1.X - 10, pt1.Y - 10, 20, 20);
    e.Graphics.DrawEllipse(pnRed, pt2.X - 10, pt2.Y - 10, 20, 20);
    e.Graphics.DrawEllipse(pnRed, pt3.X - 10, pt3.Y - 10, 20, 20);
    e.Graphics.DrawEllipse(pnRed, pt4.X - 10, pt4.Y - 10, 20, 20);
}
This would produce:

This means that, if you want a real curve, either you don't pass the tension argument and use the first version of the method or you pass the tension argument as a value higher than 0.00. Here is an example:
private void Exercise_Paint(object sender, PaintEventArgs e)
{
    Pen pnRed = new Pen(Color.FromArgb(155, 255, 15, 15), 1.50F);

    Pen penCurrent = new Pen(Color.Blue, 4.50F);

    Point pt1 = new Point( 40,  42);
    Point pt2 = new Point(188, 246);
    Point pt3 = new Point(484, 192);
    Point pt4 = new Point(350,  48);
    Point[] pts = { pt1, pt2, pt3, pt4 };

    e.Graphics.DrawCurve(tension: 2.15F, pen: penCurrent, points: pts);

    e.Graphics.DrawEllipse(pnRed, pt1.X - 10, pt1.Y - 10, 20, 20);
    e.Graphics.DrawEllipse(pnRed, pt2.X - 10, pt2.Y - 10, 20, 20);
    e.Graphics.DrawEllipse(pnRed, pt3.X - 10, pt3.Y - 10, 20, 20);
    e.Graphics.DrawEllipse(pnRed, pt4.X - 10, pt4.Y - 10, 20, 20);
}
This would produce:

Both versions of the DrawCurve() method that we have used allow you to start the curve on the first point. Consider the following example that draws a curve of five points resulting in four segments:
private void Exercise_Paint(object sender, PaintEventArgs e)
{
    Pen pnRed = new Pen(Color.FromArgb(155, 255, 15, 15), 1.50F);

    Pen penCurrent = new Pen(Color.Blue, 8.257F);

    PointF pt1 = new PointF( 40.00F, 345.00F);
    PointF pt2 = new PointF(145.00F,  45.00F);
    PointF pt3 = new PointF(235.00F, 265.00F);
    PointF pt4 = new PointF(295.00F,  50.00F);
    PointF pt5 = new PointF(400.00F, 345.00F);
    PointF[] pts = { pt1, pt2, pt3, pt4, pt5 };

    e.Graphics.DrawCurve(points: pts, pen: penCurrent);

    e.Graphics.DrawEllipse(pnRed, pt1.X - 15, pt1.Y - 15, 30, 30);
    e.Graphics.DrawEllipse(pnRed, pt2.X - 15, pt2.Y - 15, 30, 30);
    e.Graphics.DrawEllipse(pnRed, pt3.X - 15, pt3.Y - 15, 30, 30);
    e.Graphics.DrawEllipse(pnRed, pt4.X - 15, pt4.Y - 15, 30, 30);
    e.Graphics.DrawEllipse(pnRed, pt5.X - 15, pt5.Y - 15, 30, 30);
}
This would produce:

Offsetting the Tension of a Curves
If you want, you can start the curve on any point instead of the first. To support this, the Graphics class provides the following version of the DrawCurve() method:
public void DrawCurve(Pen pen,
                      PointF[] points,
                      int offset,
                      int numberOfSegments);
The offset argument allows you to specify the number of points that should be skipped before starting to draw. The first conclusion is that the value of the offset argument must be 0 or higher. If you pass this argument as 0, the curve would be drawn from the first point. If you pass this argument as 1, the first point would not be considered in the curve. This means that the drawing of the curve would start on the second point and so on. If you pass it as 2, the first and the second point would not be part of the curve, meaning that the curve would start on the third point.
After the curve has started from the point you specify using the offset argument, you can then specify the number of segments on which the curve would be drawn. This number must be lower than the number of available segments, that is after subtracting the offset value from the total number of segments of the array. Here is an example:
private void Exercise_Paint(object sender, PaintEventArgs e)
{
    Pen pnRed  = new Pen(Color.FromArgb(155, 255, 15, 15), 1.50F);

    Pen penCurrent = new Pen(Color.Blue, 3.50F);

    PointF pt1 = new PointF( 20.00F, 325.00F);
    PointF pt2 = new PointF(125.00F,  25.00F);
    PointF pt3 = new PointF(215.00F, 245.00F);
    PointF pt4 = new PointF(275.00F,  30.00F);
    PointF pt5 = new PointF(380.00F, 325.00F);
    PointF[] pts = { pt1, pt2, pt3, pt4, pt5 };

    e.Graphics.DrawCurve(points: pts, pen: penCurrent, offset: 1, numberOfSegments: 2);

    e.Graphics.DrawEllipse(pnRed, pt1.X - 10, pt1.Y - 10, 20, 20);
    e.Graphics.DrawEllipse(pnRed, pt2.X - 10, pt2.Y - 10, 20, 20);
    e.Graphics.DrawEllipse(pnRed, pt3.X - 10, pt3.Y - 10, 20, 20);
    e.Graphics.DrawEllipse(pnRed, pt4.X - 10, pt4.Y - 10, 20, 20);
    e.Graphics.DrawEllipse(pnRed, pt5.X - 10, pt5.Y - 10, 20, 20);
}
This would produce:

Straightening the Tension of a Curve
Once again, the compiler arranges to apply a tension when drawing the curve. If you would prefer to use straight lines or to apply a different tension than the default, you can use the following version of the Graphics.DrawCurve() method:
public void DrawCurve(Pen pen,
                      Point[] points,
                      int offset,
                      int numberOfSegments,
                      float tension);
public void DrawCurve(Pen pen,
                      PointF[] points,
                      int offset,
                      int numberOfSegments,
                      float tension);
This time, you can pass the value of the tension as 0 to get straight lines. Here is an example:
private void Exercise_Paint(object sender, PaintEventArgs e)
{
    Pen pnRed  = new Pen(Color.FromArgb(155, 255, 15, 15), 1.50F);

    Pen penCurrent = new Pen(Color.Blue, 3.50F);

    PointF pt1 = new PointF( 20.00F, 325.00F);
    PointF pt2 = new PointF(125.00F,  25.00F);
    PointF pt3 = new PointF(215.00F, 245.00F);
    PointF pt4 = new PointF(275.00F,  30.00F);
    PointF pt5 = new PointF(380.00F, 325.00F);
    PointF[] pts = { pt1, pt2, pt3, pt4, pt5 };

    e.Graphics.DrawCurve(points: pts, pen: penCurrent, tension: 0, numberOfSegments: 4, offset: 0);

    e.Graphics.DrawEllipse(pnRed, pt1.X - 10, pt1.Y - 10, 20, 20);
    e.Graphics.DrawEllipse(pnRed, pt2.X - 10, pt2.Y - 10, 20, 20);
    e.Graphics.DrawEllipse(pnRed, pt3.X - 10, pt3.Y - 10, 20, 20);
    e.Graphics.DrawEllipse(pnRed, pt4.X - 10, pt4.Y - 10, 20, 20);
    e.Graphics.DrawEllipse(pnRed, pt5.X - 10, pt5.Y - 10, 20, 20);
}
This would produce:

Or you can pass the tension with any positive value of your choice. Here is an example:
private void Exercise_Paint(object sender, PaintEventArgs e)
{
    Pen penCurrent = new Pen(Color.FromName("FireBrick"), 13.727F);
    PointF[] pts = { new PointF(20.00F, 322.00F),
                     new PointF(84, 64),
                     new PointF(234, 242),
                     new PointF(495, 68),
                     new PointF(600.00F, 422.00F) };

    e.Graphics.DrawCurve(penCurrent, pts, 1, 3, 1.750F);

    e.Graphics.DrawEllipse(new Pen(Color.Green, 2.15F), pts[0].X - 15, pts[0].Y - 15, 30, 30);
    e.Graphics.DrawEllipse(new Pen(Color.Red, 2.15F), pts[1].X - 15, pts[1].Y - 15, 30, 30);
    e.Graphics.DrawEllipse(new Pen(Color.Blue, 2.15F), pts[2].X - 15, pts[2].Y - 15, 30, 30);
    e.Graphics.DrawEllipse(new Pen(Color.Tomato, 2.15F), pts[3].X - 15, pts[3].Y - 15, 30, 30);
    e.Graphics.DrawEllipse(new Pen(Color.Maroon, 2.15F), pts[4].X - 15, pts[4].Y - 15, 30, 30);
}
This would produce:

A Closed Curve
Introduction
If you call the Graphics.DrawCurve() method, you would get a regular curved line that has a beginning and an end point. Normally, since the start and end points are not the same, the shape would look open. In some cases, you may want the curce to appear as a closed object. To help you draw such a shape, the Graphics class is equipped with an overloaded method named DrawClosedCurve. One of its syntaxes is:
public void DrawClosedCurve(Pen pen, Point[] points);
This method takes a Point object as argument. The method draws a series of lines but joins the end of the last line to the beginning of the first line to have a closed shape. Here is an example:
private void Exercise_Paint(object sender, PaintEventArgs e)
{
    Pen penCurrent = new Pen(Color.SaddleBrown, 18.002F);
    Point[] pts = { new Point(80,  82), new Point(118, 346),
                new Point(484, 392), new Point(650,  48) };

    e.Graphics.DrawClosedCurve(penCurrent, pts);
}
This would produce:

The points in the above version of the method use integers. To allow you to apply more precision to the coordinates of the curve, Graphics class provides another version of the method as follows:
public void DrawClosedCurve (System.Drawing.Pen pen, System.Drawing.PointF[] points);
This version takes an array of PointF objects that use floating-point numbers and perform the drawing operation like the other version.
A Tension for a Closed Curve
The above two versions draw the lines but curve them in order to make the shape appear smooth. If you want, you can draw the lines straight from one point to the next without curving them. To support this scenario, the Graphics class provides another version of its DrawClosedCurve method. One of its syntaxes is:
public void DrawClosedCurve(Pen pen,
                            Point[] points,
                            float tension,
                            FillMode fillmode);
This version primarily takes a pen and an array of points for its first two arguments. The third argument allows you to specify how much curve would be applied, which is referred to as a tension, passed as a decimal number. If you pass this value as 0.00, the points would be joined with straight lines. Otherwise, you can apply a tension using an appropriate decimal value.
The last argument, the fillmode factor, determines how the interior of the curve would be filled. It is controlled through an enumeration named FillMode. This enumeration is defined in the System.Drawing.Drawing2D namespace. The FillMode enumeration has two members: Alternate and Winding. Here is an example of calling the above method:
using System.Drawing.Drawing2D;

namespace GraphicalApplication
{
    public partial class Exercise : Form
    {
        public Exercise()
        {
            InitializeComponent();
        }

        private void Exercise_Paint(object sender, PaintEventArgs e)
        {
            Pen penRed  = new Pen(Color.FromArgb(155, 255, 15, 15), 2.50F);

            Pen penCurrent = new Pen(Color.Blue, 4.50F);

            Point pt1 = new Point(215, 125);
            Point pt2 = new Point(255, 345);
            Point pt3 = new Point(725, 235);
            Point pt4 = new Point(725,  55);

            Point[] pts = { pt1, pt2, pt3, pt4 };

            e.Graphics.DrawEllipse(penRed, pt1.X - 10, pt1.Y - 10, 20, 20);
            e.Graphics.DrawEllipse(penRed, pt2.X - 10, pt2.Y - 10, 20, 20);
            e.Graphics.DrawEllipse(penRed, pt3.X - 10, pt3.Y - 10, 20, 20);
            e.Graphics.DrawEllipse(penRed, pt4.X - 10, pt4.Y - 10, 20, 20);

            e.Graphics.DrawClosedCurve(penCurrent, pts, 1.55F,
                                       FillMode.Winding);
        }
    }
}
This would produce:

Remember that the higher the tension, the sharper the corners. If you want the shape to show straight lines, pass a tension of 0.00F. Here is an example:

We used a Graphics.DrawClosedCurve() method with points that use natural numbers. If you want the points to use more precision, the Graphics class provides the following version of the method:
public void DrawClosedCurve(Pen pen,
                            PointF[] points,
                            float tension,
                            FillMode fillmode);
Bézier Curves
Introduction
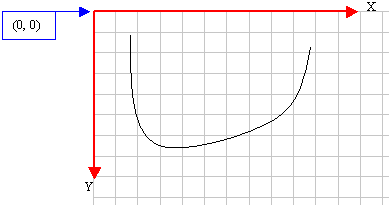
A bézier curve is a continuous line that is drawn using four points that are not necessarily aligned. It can be illustrated as follows:
A Bézier Curve from Points
To support bézier curves, the Graphics class is equipped with an overloaded method named DrawBezier.
One way to draw a bézier curve is by using four points. To support this, the Graphics class provides a version of the its DrawBezier() method whose syntax is:
public void DrawBezier(Pen pen,
                       Point pt1,
                       Point pt2,
                       Point pt3,
                       Point pt4);
To get a bézier curve, the compiler would draw a curve from the first point to the fourth point. Then it would bend the curve by bringing each middle (half-center) side close to the second and the third points respectively, without touching those second and third points. For example, the above bézier curve could have been drawn using the following four points:
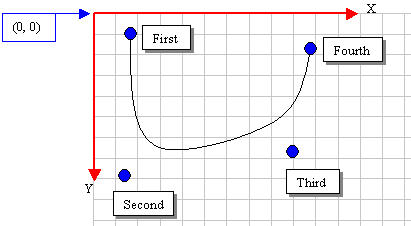
Based on this, to draw a bézier line, you can use either four Point objects or the coordinates of the four points. Here is an example:
private void Exercise_Paint(object sender, PaintEventArgs e)
{
    Pen penCurrent = new Pen(Color.FromName("MediumOrchid"), 9.926F);

    Point pt1 = new Point(20, 22),
          pt2 = new Point( 88, 446),
          pt3 = new Point(664, 292),
          pt4 = new Point(350,  88);

    e.Graphics.DrawBezier(penCurrent, pt1, pt2, pt3, pt4);
}
This would produce:

In the above example, we used natural numbers for the points. If you need the points to use more precision that require decimal numbers, the Graphics class provides another version of the its DrawBezier() method whose syntax is:
public void DrawBezier(Pen pen,
                       PointF pt1,
                       PointF pt2,
                       PointF pt3,
                       PointF pt4);
If you want to draw many bézier curves, you can call the Graphics.DrawBezier() many times and pass the appropriate arguments for each call. Here is an example that draws two bézier curves
private void Exercise_Paint(object sender, PaintEventArgs e)
{
    Graphics graph = e.Graphics;
    GraphicsPath path = new GraphicsPath();

    Pen pnMain = new(Color.Tomato, 8.25f);

    Point pt1  = new(40, 42);
    Point pt2  = new(88, 246);
    Point pt3  = new(564, 192);
    Point pt4  = new(384, 48);

    graph.DrawBezier(pnMain, pt1, pt2, pt3, pt4);

    pt1 = new( 80, 426);
    pt2 = new( 46,  68);
    pt3 = new(357, 288);
    pt4 = new(539, 137);
    pnMain.Color = Color.Olive;

    graph.DrawBezier(pnMain, pt1, pt2, pt3, pt4);
}
This would produce:

To draw a bézier curve, you can define individual points. To support this, the Graphics class provides another version of its DrawBezier() method. Its syntaxes are:
public void DrawBezier(Pen pen,
                       float x1,
                       float y1,
                       float x2,
                       float y2,
                       float x3,
                       float y3,
                       float x4,
                       float y4);
Here is an example:
namespace GraphicalApplication
{
    public partial class Exercise : Form
    {
        public Exercise()
        {
            InitializeComponent();
        }

        private void Exercise_Paint(object sender, PaintEventArgs e)
        {
            float startPointX         =  44.26F;
            float startPointY         =  32.38F;
            float firstControlPointX  = 108.48F;
            float firstControlPointY  = 666.72F;
            float secondControlPointX = 885.55F;
            float secondControlPointY = 412.74F;
            float endPointX           = 670.69F;
            float endPointY           =  88.44F;

            Pen pnMarker = new Pen(Color.Blue, 2.50F);
            Pen pnRed    = new Pen(Color.FromArgb(155, 255, 15, 15), 5.50F);

            e.Graphics.DrawBezier(pnRed,
                                  startPointX, startPointY,
                                  firstControlPointX, firstControlPointY,
                                  secondControlPointX, secondControlPointY,
                                  endPointX, endPointY);

            e.Graphics.DrawEllipse(pnMarker, startPointX         - 10.00F, startPointY         - 10.00F, 20.00F, 20.00F);
            e.Graphics.DrawEllipse(pnMarker, firstControlPointX  - 10.00F, firstControlPointY  - 10.00F, 20.00F, 20.00F);
            e.Graphics.DrawEllipse(pnMarker, secondControlPointX - 10.00F, secondControlPointY - 10.00F, 20.00F, 20.00F);
            e.Graphics.DrawEllipse(pnMarker, endPointX           - 10.00F, endPointX           - 10.00F, 20.00F, 20.00F);
        }
    }
}
This would produce:

A Series of Bézier Curves
The Graphics.DrawBezier() method is used to draw one bézier curve. To allow yout to draw many bézier curves, the Graphics class provides an overloaded method named DrawBeziers. One of its syntaxes is:
public void DrawBeziers(System.Drawing.Pen pen, params System.Drawing.Point[] points);
This method expects an array points that is a multiple of 3 plus 1. Here is an example that uses 4 points:
private void Exercise_Paint(object sender, PaintEventArgs e)
{
    Pen penCurrent = new Pen(Color.FromArgb(238, 26, 4), 13.725F);
    Point[] pts = { new Point(52,  62), new Point(88, 346),
           new Point(664, 392), new Point(350,  48) };

    e.Graphics.DrawEllipse(new Pen(Color.Green, 3.15F), pts[0].X - 25, pts[0].Y - 25, 50, 50);
    e.Graphics.DrawEllipse(new Pen(Color.Purple, 3.15F), pts[1].X - 25, pts[1].Y - 25, 50, 50);
    e.Graphics.DrawEllipse(new Pen(Color.LightBlue, 3.15F), pts[2].X - 25, pts[2].Y - 25, 50, 50);
    e.Graphics.DrawEllipse(new Pen(Color.Pink, 3.15F), pts[3].X - 25, pts[3].Y - 25, 50, 50);

    e.Graphics.DrawBeziers(penCurrent, pts);
}
This would produce:

A characteristic of using DrawBeziers() is that it allows you to draw a bézier curve using a multiple of 3 plus 1 Point. Here is an example of calling that method:
private void Exercise_Paint(object sender, PaintEventArgs e)
{
    Pen penCurrent = new Pen(Color.FromName("ForestGreen"), 16.006F);
    Point[] pts = { new Point( 40,   85),
                    new Point(640,  60),
                    new Point(620, 248),
                    new Point(450, 200),
                    new Point( 54, 320),
                    new Point(550, 325),
                    new Point(604, 440) };

    BackColor = Color.MidnightBlue;

    e.Graphics.DrawEllipse(new Pen(Color.Magenta, 3.15F), pts[0].X - 25, pts[0].Y - 25, 50, 50);
    e.Graphics.DrawEllipse(new Pen(Color.Bisque,  3.15F), pts[1].X - 25, pts[1].Y - 25, 50, 50);
    e.Graphics.DrawEllipse(new Pen(Color.MediumSpringGreen, 3.15F), pts[2].X - 25, pts[2].Y - 25, 50, 50);
    e.Graphics.DrawEllipse(new Pen(Color.Pink,    3.15F), pts[3].X - 25, pts[3].Y - 25, 50, 50);
    e.Graphics.DrawEllipse(new Pen(Color.Goldenrod, 3.15F), pts[4].X - 25, pts[4].Y - 25, 50, 50);
    e.Graphics.DrawEllipse(new Pen(Color.Yellow, 3.15F), pts[5].X - 25, pts[5].Y - 25, 50, 50);
    e.Graphics.DrawEllipse(new Pen(Color.Cornsilk, 3.15F), pts[6].X - 25, pts[6].Y - 25, 50, 50);

    e.Graphics.DrawBeziers(penCurrent, pts);
}
This would produce:

The above Graphics.DrawBeziers() method uses points of natural numbers. If you want to use points with more precision, the Graphics class proposes another version with the following syntax:
public void DrawBeziers(System.Drawing.Pen pen, params System.Drawing.PointF[] points);
![]() Practical Learning: Ending the Lesson
Practical Learning: Ending the Lesson
|
|
|||
| Previous | Copyright © 2010-2024, FunctionX | Tuesday 07 May 2024 | Next |
|
|
|||